If you've been listening to CarProUSA Radio Show host Jerry Reynolds on the weekly show, you've heard him talk about the ongoing global microchip shortage impacting new vehicle supply, resulting in high used car prices. You've also heard him urge those with a trade-in to take advantage of the current market and subsequent high trade-in values.
The latest research from iSeeCars from June proves his point. The data taken from over 1.9 million used car sales in June, shows used vehicle prices continued to rise in June due to the chip shortage. Used car prices increased 32.7 percent, or $7,583, last month compared to the same period the previous year. This comes after a 26.4 percent year-over-year increase in May and a 16.8 percent year-over-year increase in April.
Here's a look at the data by city in some of our CarProUSA Radio markets. San Antonio and Houston both make the top 10 cities with the largest average used car prices increases year to year in the first six months.
- San Antonio (3) - 39.5% // $ Change from June 2020: $8,911
- Houston (8) - 37.7%// $ Change from June 2020: $8,828
- Columbus, OH (15) - 34.4%// $ Change from June 2020: $7,086
- Austin (17) - 34.4% // $ Change from June 2020: $7,970.
- Dallas-Fort Worth (21) - 33.8% // $ Change from June 2020: $7,980.
- Sacramento-Stockton-Modesto (22) - 33/6% // $ Change from June 2020: $7,582
- Portland OR (23) - 33.4% // $ Change from June 2020: $7,886
- Los Angeles (25) - 32.6% // $ Change from June 2020: $7,505
- San Diego (31) - 31.8% // $ Change from June 2020: $7,108
iSeeCars's study of June's numbers also identified the vehicles with higher-than-average price increases, making them the worst vehicles to buy and the best cars to trade in.
Other vehicles had lower-than-average price increases, making them smart buys for consumers who can’t wait for prices to drop.
Here is iSeeCar's list of the top 10 cars with the greatest price increases year-over-year in June.
| Top 10 Cars with the Greatest Price Increases (YoY) - iSeeCars June 2021 Study* | ||||
| Rank | Used Vehicle | Average Used Car Price (June 2021) | $ Price Change from June 2020 | % Price Change from June 2020 |
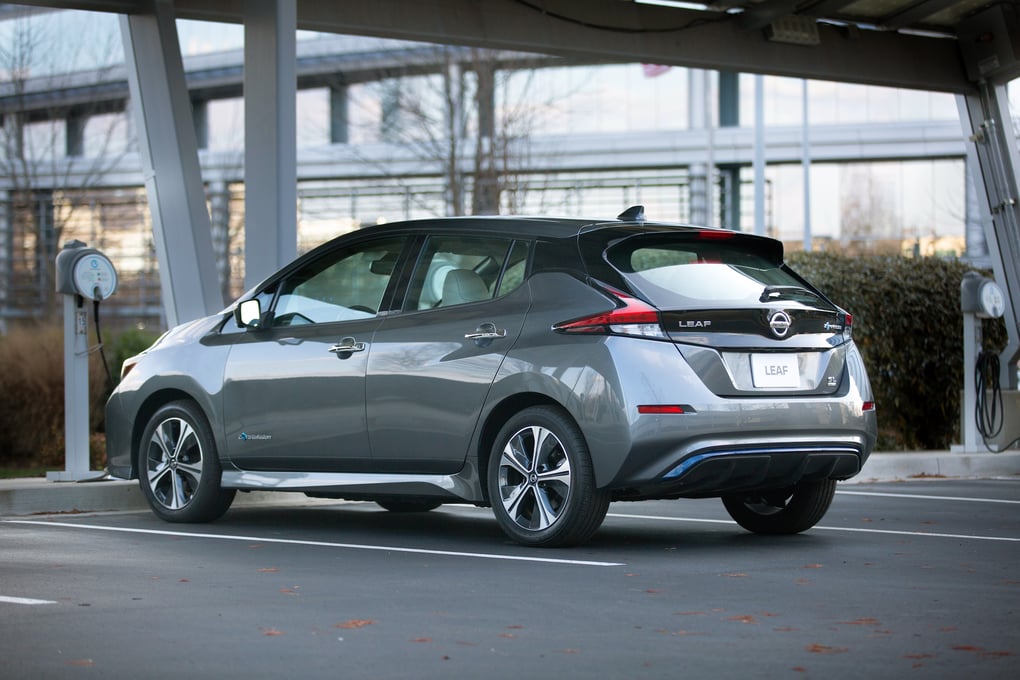
| 1 | Nissan LEAF | $20,015 | $6,501 | 48.1% |
| 2 | Mercedes-Benz G-Class | $158,835 | $50,271 | 46.3% |
| 3 | Chevrolet Camaro | $36,163 | $11,242 | 45.1% |
| 4 | Lincoln Navigator L | $66,508 | $20,392 | 44.2% |
| 5 | Ram Pickup 1500 | $40,200 | $12,016 | 42.6% |
| 6 | Lincoln Navigator | $65,236 | $19,411 | 42.4% |
| 7 | Audi A5 | $44,376 | $13,076 | 41.8% |
| 8 | GMC Sierra 1500 | $47,791 | $13,963 | 41.3% |
| 9 | Ford Mustang | $36,476 | $10,656 | 41.3% |
| 10 | Chevrolet Spark | $13,892 | $4,015 | 40.6% |
| Average | $30,766 | $7,583 | 32.7% | |
| Top 10 Cars with the Smallest Price Increases (YoY) - iSeeCars June 2021 Study* | ||||
| Rank | Used Vehicle | Average Used Car Price (June 2021) | $ Price Change from June 2020 | % Price Change from June 2020 |
| 1 | Mercedes-Benz GLC | $33,936 | $3,867 | 11.4% |
| 2 | Volvo XC90 | $37,099 | $4,681 | 12.6% |
| 3 | Audi SQ5 | $40,028 | $5,768 | 14.4% |
| 4 | Subaru Crosstrek | $21,570 | $3,271 | 15.2% |
| 5 | Audi Q7 | $37,616 | $6,324 | 16.8% |
| 6 | Tesla Model S | $52,771 | $9,240 | 17.5% |
| 7 | Hyundai Accent | $11,505 | $2,019 | 17.5% |
| 8 | Audi A7 | $38,755 | $6,836 | 17.6% |
| 9 | Mazda CX-3 | $17,057 | $3,074 | 18.0% |
| 10 | Mitsubishi Outlander | $16,618 | $3,031 | 18.2% |
| Average | $30,766 | $7,583 | 32.7% | |
For more on the study visit iSeeCars.com.
